Graphical Network Monitoring tool

If you want to figure out where all your bandwidth is getting used, without bothering with Networking, protocols and IP addresses try Etherape.

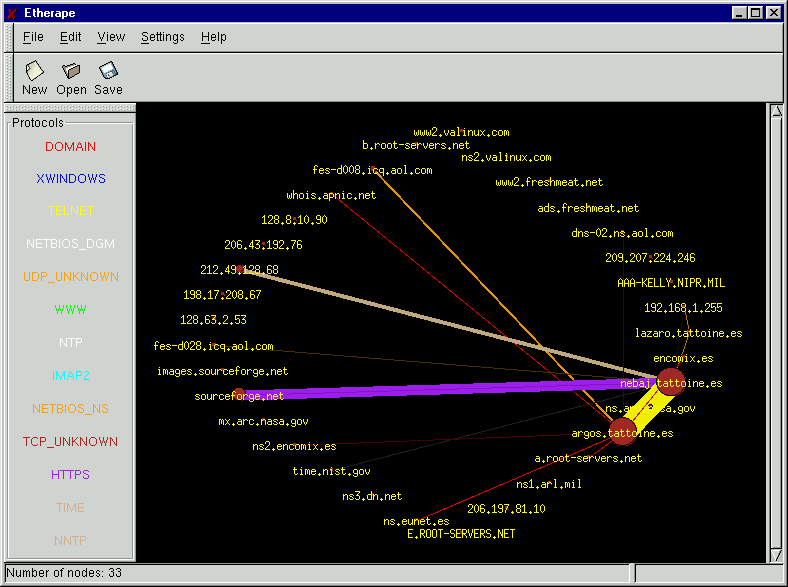
Etherape provides an easy to understand graph of all your network traffic in real time. This is how it works.

  • It shows all your IPs/computers on your network.
  • The more the traffic the thicker the connection gets between the IPs.
  • It uses colour codes to denote the type of traffic on your network.

You can change to different network interfaces from capture interfaces. For best results run this on your internet gateway.

Leave a Reply

This site uses Akismet to reduce spam. Learn how your comment data is processed.

A note to our visitors

This website has updated its privacy policy in compliance with changes to European Union data protection law, for all members globally. We’ve also updated our Privacy Policy to give you more information about your rights and responsibilities with respect to your privacy and personal information. Please read this to review the updates about which cookies we use and what information we collect on our site. By continuing to use this site, you are agreeing to our updated privacy policy.

Scroll to Top